
By the time renewal season rolls around, the decision is rarely a clean academic question. It’s a district leader staring at competing realities and trying to make a choice that will hold up under scrutiny.
On one screen, there’s a vendor slide deck. Crisp design. Strong headlines. Clean charts that climb politely upward. A testimonial quote that reads like it was written for a conference lanyard. A summary page that signals, without saying it outright, that the decision should be easy.
On the other, district data. Messier. Uneven across schools. Benchmark trends that don’t move in sync. Attendance patterns that wobble. A subgroup line that dips when it should rise. A few campuses that look like entirely different districts.
And somewhere in the middle of those two realities sits the question that matters: Did this tool, service, or intervention actually improve outcomes for our students enough to justify keeping it, expanding it, or replacing it?
That’s the moment when vendor-provided impact reports often appear. They can be useful. They can offer signals, highlights, and helpful framing. They’re also not neutral by design.
Vendor-provided impact reports can be informative—but relying on them exclusively is risky. Incentives, design choices, and missing comparisons can quietly distort conclusions.
If districts want defensible decisions, they need to understand where vendor impact reports fall short—and what stronger evidence looks like.
Why Vendor Impact Reports Are So Persuasive
In many cases, they’re responding to real district pressure. These reports arrive at exactly the right time. They show up when budgets are tight, and renewal conversations are moving fast. They’re often aligned with procurement rhythms and built for quick consumption.
Clarity feels like certainty. But persuasion is not the same as proof.
The problem isn’t what vendor reports include. It’s what they systematically leave out. And those omissions matter most when the decision is not “Do we like this tool?” but “Is this improving outcomes for our students in a way that justifies the investment?”
Reason #1: Incentives Shape the Story (Cherry-Picked Impact)
The Incentive Problem

Every impact report is shaped by choices: which students count, which outcomes matter, what time window is used, what “implementation” means, and what comparisons are considered fair. In vendor-created reports, those choices don’t happen in a vacuum.
Vendors are incentivized to:
- highlight success
- protect renewals
- accelerate sales
- strengthen marketing narratives
- reduce risk in decision conversations
The Most Common Distortion: Selective Inclusion
If you’ve read enough vendor reports, you’ve seen the same phrases show up again and again:
- “Students who used the product with fidelity”
- “High-engagement users”
- “Students who completed X lessons”
- “Schools with full implementation”
- “Teachers who met usage targets”
On the surface, these sound reasonable. But here’s the problem: engagement is not random.
Students who engage consistently differ from students who do not in ways that matter for outcomes. They may have stronger attendance, more support, higher baseline achievement, fewer schedule disruptions, or simply more stability in their learning environment. Even when a vendor isn’t cherry-picking, selecting “high users” can inflate reported impact because the comparison is baked in.
This is selection bias, even when it’s unintentional. It’s one of the biggest reasons districts should question vendor-provided impact reports, especially when the report’s headline results depend on a narrow slice of the student population.
Real-World Example: The Gamified Math Software Trap
A large school district received an impact report from an EdTech company offering a gamified math product. The vendor report showed that students who “used the product with fidelity” demonstrated accelerated growth in math scores. It looked like exactly what district leaders want to see: a clear, positive result, and a simple story.
But the definition of “fidelity” came with a catch.
In this case, “using the product with fidelity” meant that students passed a certain level in the math game. In other words, it wasn’t simply “logged in regularly” or “spent time on the platform.” It was “advanced through the game.”
What that meant in practice was this: the report only considered students who were already capable of making early progress through the levels. Students who logged in frequently but stayed stuck at the first levels were excluded from the impact claims.
From the vendor’s perspective, it might have felt like a fair definition. They were trying to measure outcomes among students who truly “received the intervention.” But from the district’s perspective, this definition quietly removed the students whose experience mattered most.
When district researchers ran their own analysis, they included all students who used the software, not just the ones who advanced to a predefined level. And what they found was more complicated—and far more important for decision-making.
Students who did not meet the vendor’s “fidelity” threshold performed worse than students who did not use the product at all.
This was true even though those struggling students logged in dozens of times. They were not disengaged. They were trying.
The district’s research team concluded that the students who “did not use the product with fidelity” were likely students who were already struggling in math. They could not get past the early levels of the game, so they couldn’t access the higher-level content where progress might have been possible. They kept logging in, kept trying, and effectively spent instructional time stuck in a loop.
Meanwhile, other struggling students who didn’t use the product were more likely receiving support through other means: targeted teacher intervention, small groups, alternative resources, or tutoring. The students stuck in the gamified tool weren’t necessarily receiving the same support because the platform created the illusion of productive struggle.
This discovery would never have surfaced if the district relied solely on the vendor-provided report. The vendor report didn’t lie. It told a partial story: one that made the product look more effective than it was for the students who needed it most.
Reason #2: No Counterfactual Means No Causal Claim
A surprising amount of impact evidence in K–12 is built on one basic move: showing that outcomes improved after a product was introduced and inferring that the product caused the improvement.
Improvement Does Not Equal Impact
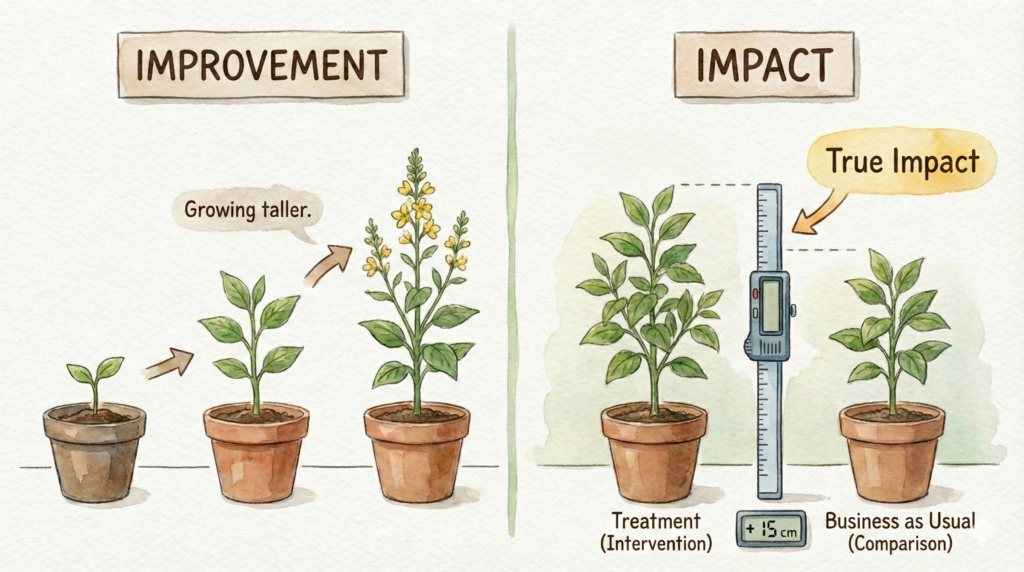
Students often improve over time regardless of intervention. Growth can result from:
- teacher instruction
- maturation
- district-wide initiatives
- shifts in staffing
Vendor reports often show before-and-after gains without asking the question that actually defines impact:
Compared To What?
If scores rose after a product was implemented, the product might have contributed. It also might have had nothing to do with the change.
The Missing Question
What would have happened if students had not used this product?
That question requires a comparison group. It requires a credible counterfactual: a stand-in for the alternate reality where those students did not receive the intervention.
Without that, a report can’t support a causal claim, but it can show a trend and even association. It can also show changes over time. But it can’t answer the question district leaders need to answer when budget decisions are on the table.
Why Vendor Reports Rarely Include a Credible Comparison
Vendors often don’t control:
- which students don’t use the product
- how districts assign tools
- what else is happening simultaneously in the system
Building a credible comparison requires:
- access to district-wide data
- methodological expertise in causal inference
- independence to report results honestly, even when they complicate the narrative
What Happens Without a Counterfactual
When there’s no credible comparison group:
- usage masquerades as effectiveness
- engagement masquerades as causality
- growth masquerades as ROI
Districts are trying to separate adoption signals from outcome signals, and that separation requires design, not just reporting.
How Independent Evaluation Fixes This
Independent evaluation doesn’t require districts to become research labs. It requires building a stronger comparison using the data districts already have.
A solid approach often looks like this:
- compare students who received the program (treatment group) to similar students who did not (comparison group)
- use pre-program data to establish baseline equivalence
- estimate the difference in outcomes, not just outcomes
- interpret results inside the reality both groups experienced
That’s why quasi-experimental designs are so useful in K–12. They’re built for settings where random assignment isn’t feasible, but decisions still need defensible evidence.
When done well, this is what an education program impact report should provide: not a story about what happened, but an estimate of what changed because of the program.
Reason #3: Results Rarely Generalize to Your District
Even when a vendor report is methodologically clean, another issue remains: transferability.
The Generalization Trap

Vendor impact reports often come from:
- pilot districts
- early adopters
- unusually supportive implementation conditions
- sites with stable staffing and strong leadership
- contexts where the vendor had intense involvement
Those settings aren’t fake, but they can be atypical. District leaders then face the unavoidable question:
- Will this work here?
- For our students?
- Under our constraints?
And the honest answer is often: not automatically.
Why Context Matters
Context varies across districts in ways that directly shape outcomes.
If a report shows impact in a district where implementation was tightly managed, training was robust, and usage was consistent, that doesn’t guarantee the same results in a district where implementation is uneven and schools are stretched thin.
The Uncomfortable Truth
A product can “work” somewhere and fail elsewhere. That doesn’t mean the product is bad. It means impact depends on conditions.
If districts treat vendor evidence as universally transferable, they can end up making expensive decisions based on someone else’s reality.
What District-Relevant Evidence Looks Like
District-relevant evidence includes:
- students in your district
- compared to your non-users
- using your outcome measures
- under your implementation conditions
That’s the difference between marketing evidence and decision evidence.
What Strong Impact Evidence Actually Requires
The goal here isn’t to shame vendors or dismiss all vendor reporting. The goal is to make decisions based on evidence that can survive real scrutiny.
Strong impact evidence usually includes a few core elements:
- Independence: the evaluator is not financially rewarded for positive results
- Comparable groups: treatment and comparison groups are meaningfully similar at baseline
- Transparent assumptions: the evaluation explains what it can and cannot claim
- Outcomes tied to decisions: measures reflect what matters for renewal, scaling, and equity
- Honest limitations: the report doesn’t oversell certainty, and it names constraints clearly
This is where rapid-cycle, independent evaluation becomes so valuable. Districts often hear “rigorous evaluation” and picture two-year studies, heavy data collection, and research timelines that don’t match procurement reality.
But rigorous doesn’t have to mean slow. Rapid-cycle evaluation can be:
- faster than RCTs
- more rigorous than dashboards and anecdotes
- aligned with decision windows like renewal cycles and budget planning
In practice, this often means using:
- quasi-experimental, between-groups pre/post designs
- multivariate matching, often via propensity scores
- existing district data rather than new surveys or burdensome collection
The point is not to make the work feel academic. The point is to produce evidence that is credible enough to guide real decisions.
Why Districts, EdTech Companies, and Nonprofits All Benefit
Independent evaluation isn’t anti-vendor. It’s pro-clarity. When evaluation is structured well, it helps every serious stakeholder.
For District Leaders
Independent impact evidence supports:
- defensible renewals and non-renewals
- budget protection under board scrutiny
- equity insight across schools and subgroups
- reduced internal burden compared to building analyses from scratch
It also helps leaders avoid the worst-case scenario: keeping a program because the story sounded good while student outcomes quietly stagnated or worsened for the students most in need.
For EdTech Companies
Independent evaluation supports:
- credibility that marketing claims can’t manufacture
- faster sales cycles by reducing the “does it work?” objection
- stronger retention with evidence tied to district outcomes
- better product feedback about where impact is strongest or weakest
For Nonprofits
Independent evaluation supports:
- grant-ready evidence that funders increasingly expect
- donor confidence grounded in objective outcomes
- stronger district partnerships through demonstrated value
Nonprofits often carry the burden of proving impact without the resources for large evaluation projects. Rapid-cycle, independent impact reports can provide the credibility needed without overwhelming internal teams.
From Skepticism to Confidence
Questioning evidence is being responsible with public dollars and student time. Vendor reports can start the conversation. But independent evaluation should inform the decision.
When districts build an evaluation culture that asks for credible comparisons, transparent definitions, and district-relevant outcomes, they move from reactive procurement to confident strategy. They stop buying narratives and start buying results.
That shift matters. Not because it makes the district look sophisticated, but because it protects students from wasted time, protects teachers from initiative churn, and protects leaders from making decisions based on evidence that can’t hold up when it counts.
Experience What Independent Evidence Feels Like
If you want to see what district-relevant, independent impact evidence actually looks like, we invite you to experience a MomentMN Snapshot Report.
MomentMN Snapshot Reports provide rapid, objective evaluations of educational products and services using existing district data, designed to answer the questions that matter inside real decision windows.
To receive a sample Snapshot Report and see how independent evaluation changes the conversation, get in touch with us today.


