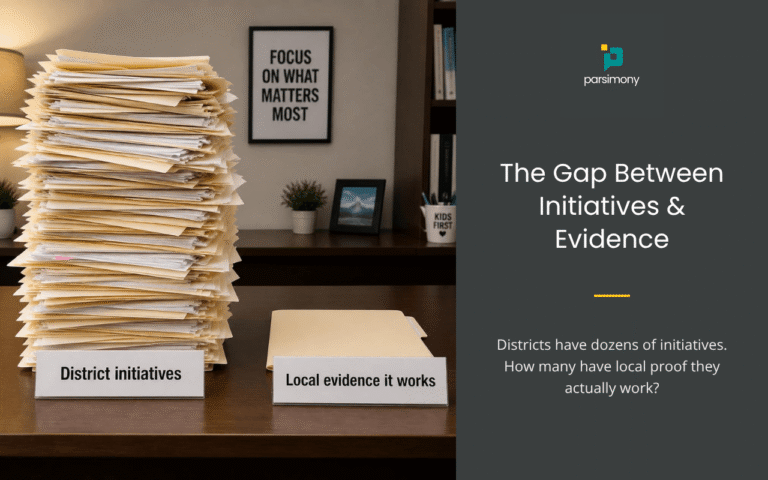

Several years ago, I worked with a school district that wanted to answer what seemed like a straightforward question. Was an expensive elementary math software program actually helping students learn?
The product had been adopted across multiple elementary schools and had been in use for several years. Teachers were assigning it regularly, students were logging in, and the vendor had provided evidence showing that districts implementing the software “with fidelity” experienced strong student growth.
From the outside, everything suggested success.
Instead of assuming the software was working because students were using it, the district asked its research department to conduct an edtech impact evaluation using its own student data.
That decision changed the conversation entirely. This distinction between edtech usage vs. outcome data is one of the most important concepts districts should understand when evaluating educational technology.
Looking Beyond the Dashboard
The district combined the vendor’s usage data with its own student assessment data. Rather than focusing only on logins, sessions, or minutes spent inside the program, researchers examined actual student outcomes.
Which students used the software? Which students did not? How did their academic performance compare?
After accounting for relevant differences between the groups, the results were surprising: students who used the software performed worse than students who did not. The finding challenged one of the most common assumptions in educational technology: that heavy usage is evidence of effectiveness.
A Login Is Not a Learning Outcome

This is one of the biggest misconceptions in educational technology. Usage metrics tell us valuable things about implementation. They can show whether students accessed a product, how frequently they returned, how much time they spent using it, and whether teachers incorporated the tool into instruction.
Those are all useful pieces of information. What they cannot tell us is whether students actually learned more because of the product.
A student can log in fifty times without improving in mathematics. Another student may complete every assigned lesson without demonstrating stronger reading comprehension.
A dashboard filled with impressive usage statistics does not answer the question that matters most: Did students benefit?
Usage is often necessary before impact can occur, but usage itself is not impact.
Why Usage Metrics Are So Convincing
This is not a criticism of vendors. Usage metrics remain popular because they are genuinely useful. They update immediately. They are easy to understand. They are already built into nearly every educational product.
District leaders can quickly see how many students logged in, how often they used the software, and whether teachers implemented the program consistently.
Those metrics help answer an important operational question: Did students use the product? Unfortunately, they are often mistaken for evidence of a completely different question: Did the product improve student outcomes?
Those questions deserve different answers. Implementation matters. But outcomes matter even more.
The Students Who Needed the Most Help

When researchers looked more closely at the district’s data, an important pattern emerged. Many of the students who began the year below grade level were using the software extensively. Some accumulated dozens of sessions throughout the school year.
Their dashboards looked excellent. Their academic growth did not. For some students, the lowest instructional level available in the software still appeared to be beyond what they were ready for. Logging in repeatedly did not solve that mismatch.
Instead, students spent more time working inside a product that may not have been appropriately aligned to their needs. The evaluation did not measure students’ confidence or attitudes toward mathematics, so we cannot conclude that the experience affected those outcomes.
Still, it is reasonable to wonder what repeated exposure without meaningful progress might do to a student’s motivation over time. Without examining actual student outcome metrics, those questions remain invisible.
When “Fidelity” Becomes a Filter

The most interesting lesson from this project had nothing to do with software. It had to do with evaluation.
The vendor’s supporting evidence defined implementation fidelity partly by whether students completed a minimum number of instructional levels.
At first glance, that seems reasonable. But consider what happens if students who struggle the most are unable to complete enough levels to meet that threshold.
Those students may quietly disappear from the evaluation sample. The students most likely to experience difficulty are no longer represented in the final results.
Imagine evaluating a staircase by studying only the people who reached the top. You would completely miss everyone who struggled on the first step. The same principle applies here.
Fidelity should describe whether implementation occurred as intended. It should not become a filter that unintentionally removes the students who benefited the least.
What Should Districts Measure Instead?
Usage data still belongs in every evaluation. It simply should not be the final measure of success.
Districts should also examine the outcomes the product claims to improve, whether that means mathematics achievement, reading growth, attendance, behavior, graduation indicators, or other student outcome metrics.
They should compare participating students with similar students who did not use the product whenever possible.
They should ask whether certain groups benefited more than others.
Did students below grade level improve? Did effects differ across schools? Did the product work equally well for different student populations?
Perhaps most importantly, districts should consider opportunity cost. Every educational product consumes time. If students spend thirty minutes using one intervention, they are not spending those thirty minutes doing something else.
That makes student outcomes far more important than activity alone. This does not mean districts should stop collecting usage data. Usage remains an important indicator of implementation, but implementation is only one piece of the picture. If we stop there, we never determine whether the product made a meaningful difference for students.
Better Questions Lead to Better Decisions
One of the greatest strengths of independent edtech evaluation is that it replaces assumptions with evidence.
Instead of asking: How many students logged in? Districts can ask: Did students improve?
Instead of asking: How many lessons did they complete? They can ask: Did participating students outperform similar students who did not receive the intervention?
Those questions produce much more useful answers for district leaders, product developers, and nonprofit partners alike.
Sometimes the results will confirm that a product is making a meaningful difference. Sometimes they will identify opportunities for improvement. Occasionally, they may reveal that a product is not benefiting the students it was designed to help. All three outcomes are valuable.
Independent evaluation does not guarantee a favorable result, but it does guarantee a more useful one.
See the Difference Between Usage Data and Impact Evidence
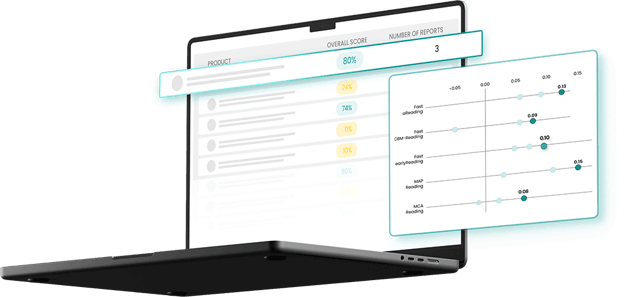
A product dashboard can show you how often students logged in. A MomentMN Snapshot Report goes further by examining whether an educational product or service was associated with meaningful changes in student outcomes.
Visit our website to receive a sample MomentMN Snapshot Report and see how independent, district-specific evidence can support better educational decisions.