
Many youth-serving nonprofits want stronger evidence of impact, but getting started can feel overwhelming.
Your team may know funders want more than stories. You may know district partners want clearer evidence of impact on student outcome. You may know your board would love stronger proof that the program is working.
But between running daily programming, managing tight budgets, supporting staff, and serving students, “rigorous evaluation” can start to sound like a mountain your team does not have the time, budget, or technical expertise to climb.
That is where many nonprofits fall into the academic trap. They assume impact measurement has to begin with a large research study, a complicated data warehouse, or a Ph.D.-level evaluation plan.
But a strong culture of evidence often begins with simple operational habits: knowing what your program is designed to change, tracking who receives which services, and making sure you can connect your program records to school district data later.
You do not need to measure everything today. All you need to do is start setting the GPS coordinates for your program’s journey.
Step 1: Chart the Roadmap
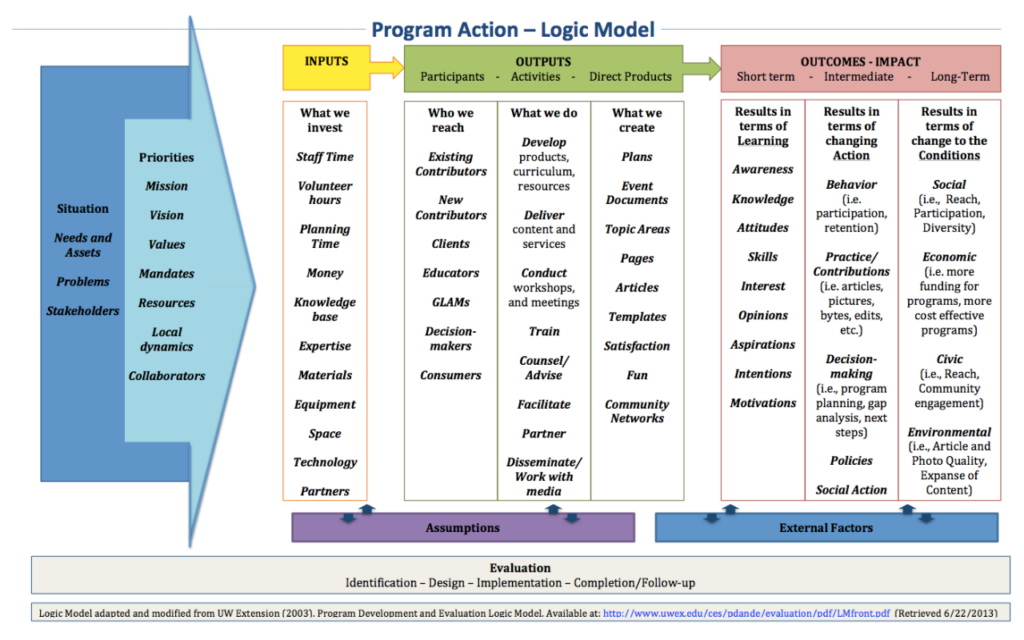
Before you can measure impact, your team needs a clear map of how your program is supposed to work. That is where a simple logic model can help.
A logic model does not need to be complicated. It can be a one-page visual that shows:
- Inputs: the resources your program uses
- Activities: what your team actually does with students
- Outputs: the immediate products or services delivered
- Outcomes: what you hope will change for students
For example, an early literacy nonprofit might list trained tutors, reading materials, school partnerships, and staff time as inputs. The activities might include small-group tutoring sessions twice per week. The outputs might include attendance, number of sessions completed, and minutes of instruction. The outcomes might include literacy growth, stronger district benchmark performance, or improved reading confidence.
This kind of map helps your team define the program’s “hero ingredient.”
If you are trying to improve reading outcomes, what is the specific thing you believe creates that growth? Is it tutoring consistency? Small-group instruction? Extra reading time? A particular curriculum? Family engagement?
A clear logic model helps your staff, board, funders, and future evaluators understand what should be measured and why. With it, your organization has a practical blueprint.
Step 2: Track the Dosage

Once your roadmap is clear, the next step is tracking participation in a disciplined but manageable way. This does not require expensive software.
It does require consistency.
At minimum, your team should know:
- Which unique students were served
- Which specific program or service each student received
- How often each student participated
- How much of the program each student actually received
Those last two pieces are dosage.
Dosage matters because impact is rarely all-or-nothing. A student who attends one tutoring session is not receiving the same intervention as a student who attends twice a week for five months. A student who participates in one mentoring lunch is not receiving the same level of support as a student who meets with a mentor every week.
If your program later appears to have no measurable impact, dosage may explain why.
A null result does not always mean the model failed. It may mean that too many students did not receive enough of the program to reasonably expect a change. It may mean the strongest results appeared only among students who attended consistently. It may mean implementation worked well at one school site but not another.
Clean tracking gives your team permission to improve. It shows whether the program delivered the intended level of service before anyone tries to judge whether the program worked.
A simple spreadsheet can be enough if it is accurate, consistent, and maintained over time. The goal is not to collect data for its own sake. The goal is to create a reliable record of what students actually received.
Step 3: Collect the Golden Key

For nonprofits serving students in public schools, one of the biggest barriers to independent evaluation is connecting program participation data to school district outcome data.
The good news is that this barrier can often be reduced during student onboarding.
When parents or guardians complete registration forms, your organization can ask for permission to request and use relevant educational data for evaluation purposes. That might include reading benchmarks, math benchmarks, attendance records, behavior data, course performance, or other student outcome metrics connected to your program goals.
This step matters because consent is often much easier to gather at the beginning of a relationship than months later when a grant deadline is approaching.
The second piece is just as important: district student ID numbers.
Once consent is in place, your organization should work with the school or district partner to identify each student’s official district ID number and enter it into your tracking system. That number is the golden key.
Without it, a future data request may require district staff to match students manually using names, birthdates, schools, and grade levels. That kind of lookup takes time, creates room for errors, and adds burden to people who are already managing full workloads.
With clean student ID numbers, the process becomes much easier.
A district data team can pull records more efficiently. An evaluator can connect participation data to student outcomes more accurately. Your nonprofit can avoid delays that might otherwise slow down a grant application, annual impact report, or partnership renewal.
This is part of what low-burden evaluation really means: doing the right small things early so the larger evaluation process does not become painful later.
Why These Small Habits Matter
A logic model, dosage tracking, and district IDs may sound simple. That is exactly why they work.
These habits create the launchpad for stronger evidence without overwhelming your team. They help your nonprofit move from broad claims about impact to cleaner, more organized, more evaluation-ready records.
They also respect your school district partners’ time.
District leaders and data teams want to support strong programs, but they are often stretched thin. The easier you make the data request, the more realistic it becomes to access the information needed for independent rigor.
These steps also help internally.
Program directors can see whether students are receiving enough service. Development directors can speak more clearly about who was served and how. Executive directors can approach funders with more confidence because the organization is no longer relying only on stories, surveys, or participation counts.
Stories still matter, but when they’re supported by clean operational data, they become much more persuasive.
How Snapshot Reports Build on This Foundation

Parsimony’s MomentMN Snapshot Reports are designed to help youth-serving nonprofits move from organized tracking to objective impact evidence.
Once your organization has a clear logic model, consistent attendance or dosage records, parent consent, and district student IDs, the path to independent evaluation becomes much smoother.
Using existing district data, MomentMN Snapshot Reports can compare students who participated in your program with similar students who did not. This allows Parsimony to estimate whether your program is associated with measurable lift on outcomes such as attendance, literacy growth, math performance, behavior, or district benchmark assessments, or GPA.
The process is designed to be rapid, rigorous, and low-burden.
Your team does not need to build a full research department. You do not need to collect every possible data point. You need a strong foundation that makes independent impact evaluation possible.
Do not let the academic trap stall your mission. Start small. Track what matters. Make future evaluation easier before you need it.
To experience what it is like to receive a MomentMN Snapshot Report describing the impact of a product or service on students in a school district, complete the form on our website to request a sample Snapshot Report.